


Technical Area | Articles
The place to solve all your BIM doubts
Gesopatial data and its implementation in BIM
BIM Implementation Software - Hardware Workflows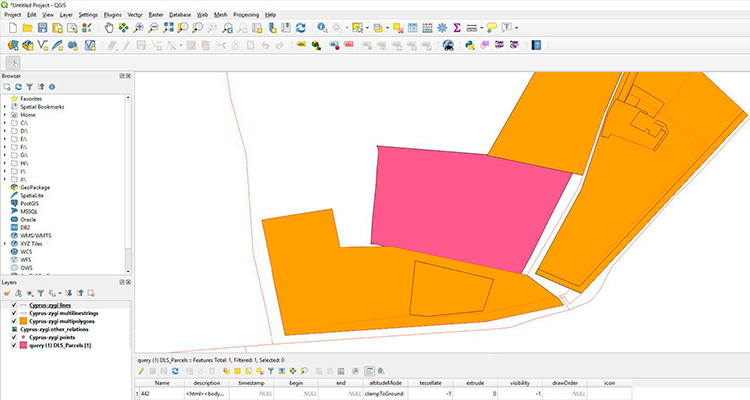

A lecture at the Technical Chamber of Greece,
Athens, 19th Feb 2020.
I recently gave a speech at the Technical Chamber of Greece in Athens for 'Digital Construction and BIM in Greece' and I wanted to share it with all of you to get your opinions on the matters of BIM and GIS.
As we look into architecture, nature, and the world around us, we get an aesthetic pleasure from it, directly on observation, but there is a rhythm and a pattern between the phenomena of the built environment and of that of nature, which isn’t apparent to the common eye, but only to the eye of analysis.

Over the next few minutes, I’m planning to talk about the general characteristics of Geospatial Data, where they came from, where to find them and how to use them in your existing BIM workflow.

Geographic data and information are defined in the ISO, as data and information having an implicit or explicit association with a location relative to Earth, and approximately 90% of government sourced data has a location component, that is why my focus is on public governmental data.
So, lets start from the beginning.

I’m skipping a few centuries of hard work here from important scholars, and thousands of maps, but I’ve selected a few of great moments in time, from the first conception of the Coordinate System from Eratosthenis, to the famous Mercator’s earth projection and to the father of ‘GIS’ , Dr. Tomlinson, that was the first to collect data and create a GIS system for the Agriculture Agency in Canada.
What’s important here is that the coordinate system, maps, computers and satellites never failed to improve, to reach what we use today on our phones to go to work.
It all became accessible and useful to a wider audience when this data is mapped using the coordinate system with accurate and traceable locations.
This start was brought by the development and launch of the Global Positioning System, ‘GPS’ in 1978.

Looking back on the development, there are three main parameters that in my opinion a GIS layer must have in order to be meaningful. First, it’s the projection classification that the globe is conceptually projected onto. Secondly, the coordinates, longitude and latitude, that indicate the exact location on earth, and the third parameter is the inclusion of any information that enriches the GIS layer and adds value for the user.

TYPES OF GIS DATA
So, what types of GIS Data are there? GIS data can be separated into two categories: spatially referenced data which is represented by vector and raster forms, and attribute tables which is represented in tabular format. Within the first data group, you find two different types: vector and raster. Most GIS software applications mainly focus on the usage and manipulation of vector geodatabases, and that’s what I’ll show today.
In the case of vector types, they can be compared to the ones we use when we design in our CAD software with the difference that the GIS vector data are referenced in a global reference system , meaning earth coordinates, whereas in a CAD software are referenced in a local reference system, x,y,z coordinates.

Where does this data come from?
Well, there’s the traditional and the modern approach, depending if the data existed in other formats or there must come from a new survey. Some of these options like the Heads up Digitising requires the physical tracing of maps on a digitising table, with a puck, that transforms table coordinates to world coordinates using an algorithm, or scanning the document and doing the same with a mouse.
In other cases like the Coordinate Geometry, they enter survey coordinates into the database, by using for example the Global Positioning Systems (GPS), that’s the most accurate way. Geo-coding is using addresses to extract the coordinates, those are usually center line data such as street center lines or water. Now, the Image processing from satellites or other types of surveys, the modeller selects a pixel that he knows the type, land use for example and according to the classification the algorithm maps the data into categories.
I want to highlight that, It takes a large effort to gather, digitise and map accurate information from different sources and I believe it's worth informing our architectural designs that end up being real-life projects, however big, or small.
The most common question I get is: Where can I find this data? And are these available and open for me to download and use?


With a simple search, you can find thousands of data for any country or city. In my experience, the most reliable data, although sometimes slowly updated, come from governmental sources. There are, of course a number of open-source-data initiatives that are doing a great job in sourcing data from public submissions and contributions. Those are ideal for concept design and in understanding the spatial complexity that surrounds your project.
STUDIO OPEN DATA
This is an example of government data websites available around the world we are constantly updating at Parametricos to help our users find those data easily. I will show a few examples of data platforms in Cyprus and Greece, later in the presentation.
Geographical systems and geospatial data are a large part of our lives even if it’s not so visible to everyone. The aggregation, and use of such data, make sure that everything is tracked, synchronised, safe and doesn’t conflict with each other.

I want you to imagine three things in the following examples. What are the parameters for each use, what will happen if we remove GIS data from the equation and lastly, think about how we can use these in our industries.

I think this one is pretty obvious. Not only are the planes guided towards their destinations with GPS and GIS data but they are also aware where all other planes are at any given moment. I can’t even imagine what will happen when we remove that functionality.

Seeing a crisis in the healthcare sector such as Coronavirus is of course devastating, and we have to find ways to deal with it. This map calculates the risk of the virus spreading in other countries and cities by looking at the traveling frequency from the core of the virus first symptoms.

Targeting issues such as the homeless population, by combining data from their location in relation to where housing and services are located. Without using and overlapping such data, our chances of coming with a really effective solution is very limited.

A city in the state of Tennessee has an online platform that shows the Sewers system and the pipe network in case of a storm or flood. This gives the opportunity for the city to keep track of the piping system condition and schedule maintenance but also for the homeowner to report any incident using this map and their location on their phones.

Earthquake simulations help predict routes to follow and create evacuation plans in such events. The more we know the more prepared we are to design better and more optimised solutions.
With that in mind, let’s move on, closer to our industry and look at examples that utilise GIS data effectively to provide information to anyone that needs them. I’m also happy at the end to demo any of these solutions.

This is the Lands and Surveys Platform in Cyprus, it has more than 150 environmental and property layers. What’s important here it’s to look at the property and real estate information that is available to the public, from Plot Real Boundary to Property Values.

These data are attached to the specific plot in those boundary coordinates. When there is an update to the plot, it’s divided for example, then the new data is uploaded again and it updates the platform in real time. All these are available for download including the GIS layer that can be imported for use in your architectural design.

I came across a similar initiative from TEE (As was presented today) the One Click Land Information System, that aims to digitise more than 70% of the governmental building process in Greece; is exactly the kind of digitisation that brings everyone on the same page.
Professionals will be able to track the Building Construction Permit process and Business Operations License. This proposed workflow, frees up the designer, the investor and operator from going to each department independently to find and utilise this kind of data.
Now, before I show a few design examples, I want to mention that, I never suggest which software or means to use to do your job well, but rather I’m here to illustrate a few possible workflows that I developed, and I saw others use as well.
What’s also important, and it was said today many times, is that technology should be applied with the correct policies.
So then, when that's said, we arrive at the bigger question. How can we use this data and solutions in our industry, to help us in all phases of a project?

First I would start by visualising and understanding the attributes of this Geospatial Data. Practically, this can be done by downloading a layer from any of the data websites and then drag and dropping them in a ‘GIS’ software.

A powerful one I use is QGIS, an open software that allows users to analyse and edit spatial information, and compose maps. One of the great things in QGIS is the wide range of import and export options that give you the ability to use the same geospatial file in other applications.

In our case, for the web, we export in ‘geojson’ where our users can upload it with their BIM Building.

Moving towards a complete implementation of Geospatial Data in our design and execution processes ensures that our projects are no longer isolated from their surrounding environment, but they can be closely observed in a virtual environment on how they fit and interact with the rest of the ecosystem.

There are numerous approaches you can take depending on the software selection you use to stream data into your BIM workflow. We tested locating BIM IFC projects on our platform with the use of IFC Site parameter, that gives you the chance to map the Point of Origin, Survey Point, Rotation and Elevation of the project. When that is done, then we can exchange between different software and minimise the risk of losing information and reference wrong locations.
Due to article length limitation please continue reading the complete article on our blog.
Read the complete article here: Geospatial data and its implementation in BIM by Marios Messios
Source: https://blog.parametricos.com/geospatial-data-and-its-implementation-in-bim/